Metadata
| Feature id | xlsx/chart-type--doughnut-chart |
|---|---|
| Format | xlsx |
| Category | charts |
| Family | xlsx/chart-type |
| Axis values | chart=doughnut-chart |
| Spec | ecma-376-5-part-1 § 21.2.2 c:chartSpace |
XPath assertions
| ID / part | Predicate | XPath | python-xlsx | xlsxjs |
|---|---|---|---|---|
chart-part-exists-doughnut-chartxl/charts/chart1.xml | existThe chart part must carry a <chartSpace> root element. For classic chart subclasses (ECMA-376 21.2.2) this is <c:chartSpace> in xl/charts/chart1.xml under the drawingml/chart namespace; for 2014+ ChartEx subclasses it is <cx:chartSpace> in xl/charts/chartEx1.xml under the office/drawing/2014/chartex namespace. The 'c' prefix in the xpath is a local binding only — it is bound per-case to whichever of those two URIs applies. | //c:chartSpace | — | — |
Render assertions
No render assertions declared.
Generator source
scripts/gen_chart_type.py
#!/usr/bin/env python3
"""Generate a ``fixtures/xlsx/chart-type--<chart-id>.xlsx`` fixture.

Parameterised: called with ``--chart-cls <ClassName> --out <path>``.
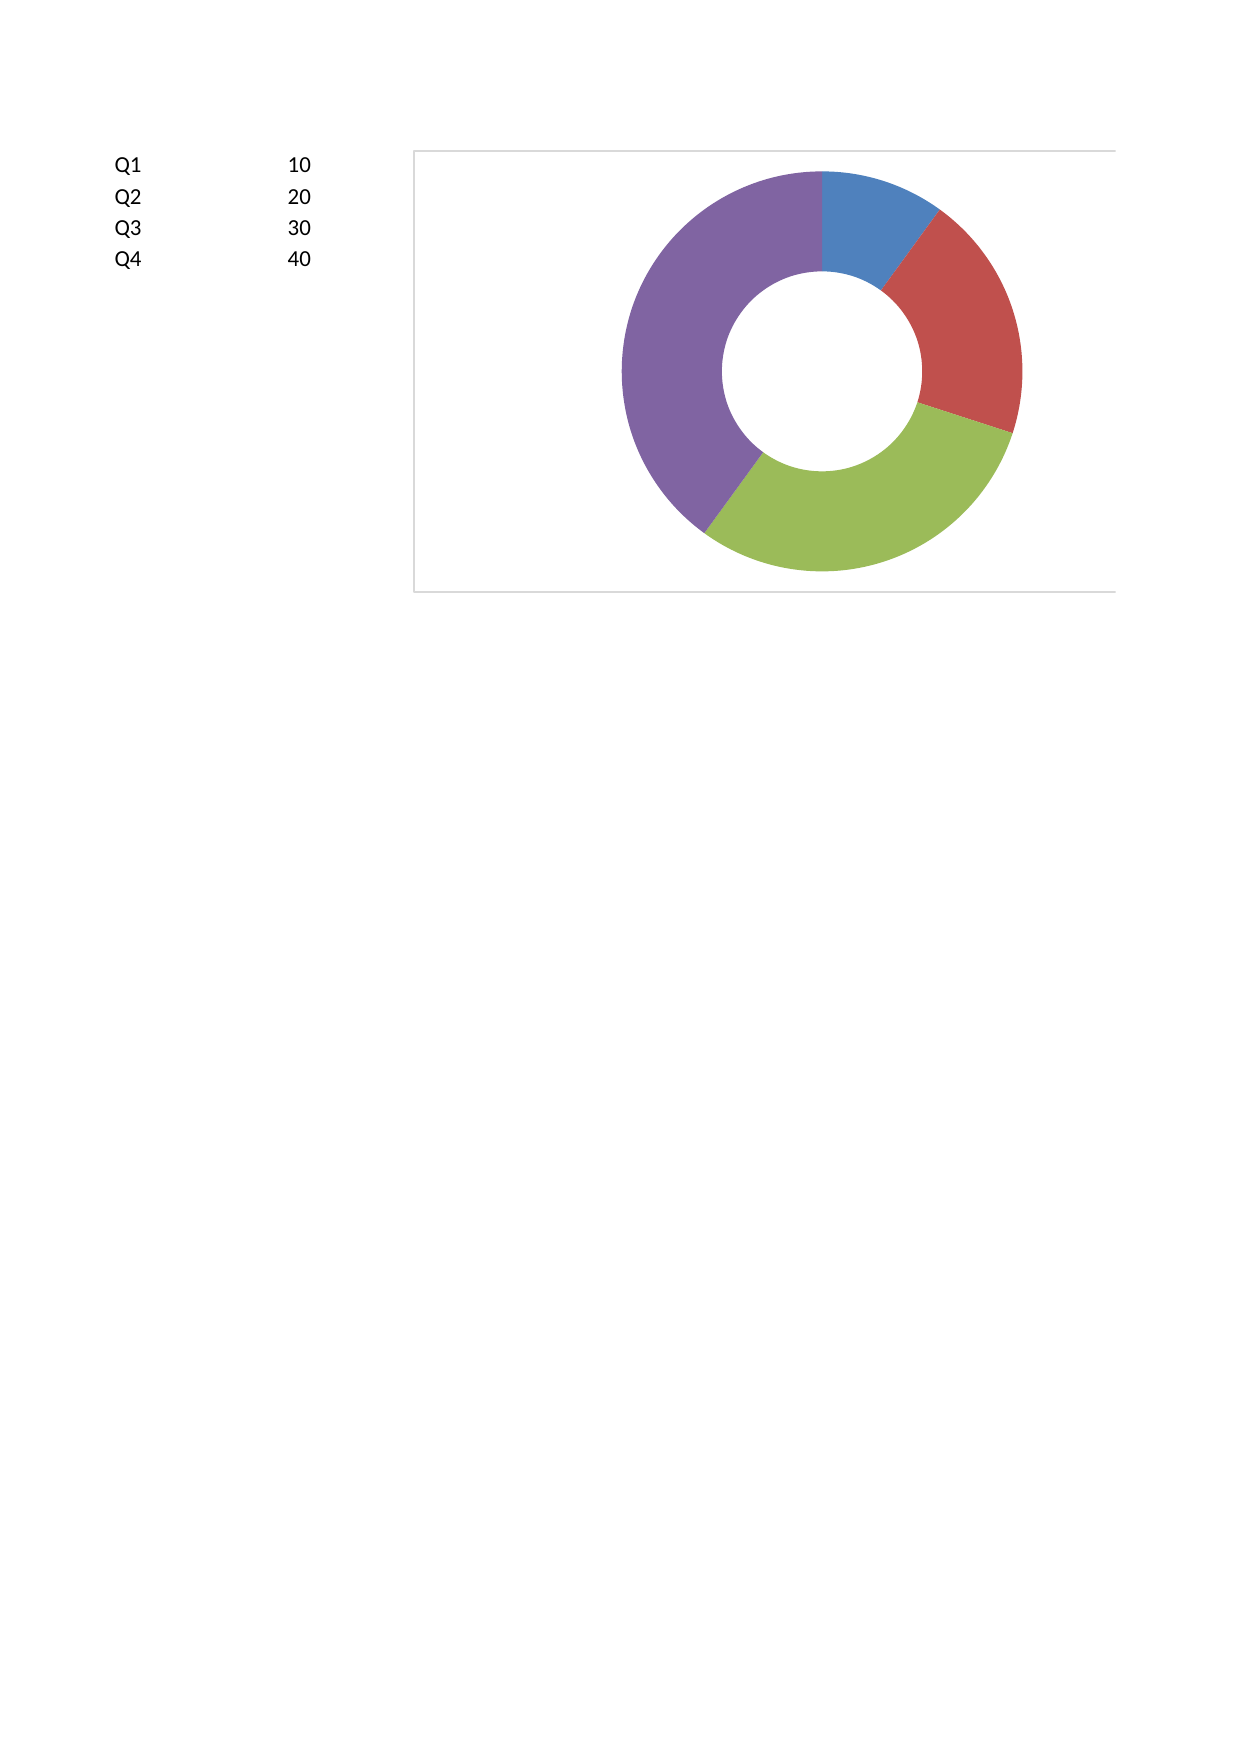
Writes a minimal one-sheet workbook with four rows of sample data
(Q1..Q4) and a chart of the named subclass bound to that data,
anchored at D1. The ``features/xlsx/chart-type.json`` manifest's
``generator.arg_template`` field drives these args at expansion time.

The ``--chart-cls`` argument must name a class exposed on
:mod:`xlsx.chart` that subclasses the ``Chart`` (or ``ChartEx``) base.
Classic chart subclasses (BarChart, PieChart, LineChart, ...) emit
``xl/charts/chart1.xml`` with the ``c:`` drawingml/chart namespace;
2014+ ChartEx subclasses (BoxWhiskerChart, FunnelChart, ...) emit
``xl/charts/chartEx1.xml`` with the ``cx:`` chartex namespace. Both
shapes satisfy the single ``//c:chartSpace`` manifest assertion once
the assertion's namespace URI is substituted per-case.
"""

from __future__ import annotations

import argparse
import datetime as _dt
from pathlib import Path

import xlsx.chart as _chart_mod
from xlsx import Workbook
from xlsx.chart import Reference

_REPO_ROOT = Path(__file__).resolve().parent.parent
_REPRODUCIBLE_DT = _dt.datetime(2000, 1, 1, 0, 0, 0)


def _write(chart_cls_name: str, out: Path) -> None:
    wb = Workbook()
    ws = wb.active
    ws["A1"] = "Q1"
    ws["B1"] = 10
    ws["A2"] = "Q2"
    ws["B2"] = 20
    ws["A3"] = "Q3"
    ws["B3"] = 30
    ws["A4"] = "Q4"
    ws["B4"] = 40

    chart_cls = getattr(_chart_mod, chart_cls_name)
    chart = chart_cls()
    data = Reference(ws, min_col=2, min_row=1, max_row=4)
    cats = Reference(ws, min_col=1, min_row=1, max_row=4)
    # Some chart subclasses (notably the ChartEx 2014+ family) do not
    # implement the classic add_data / set_categories API; swallow
    # AttributeError / TypeError there and still save the minimal
    # chart part — the manifest assertion only checks for the presence
    # of <c:chartSpace> / <cx:chartSpace>, not for wired-up series.
    try:
        chart.add_data(data, titles_from_data=False)
        chart.set_categories(cats)
    except Exception:
        pass
    ws.add_chart(chart, "D1")

    out.parent.mkdir(parents=True, exist_ok=True)
    wb.save(out, zip_date_time=_REPRODUCIBLE_DT)


def main() -> int:
    parser = argparse.ArgumentParser()
    parser.add_argument(
        "--chart-cls",
        required=True,
        help="Name of an xlsx.chart class, e.g. 'BarChart', 'LineChart', 'PieChart'.",
    )
    parser.add_argument(
        "--out",
        required=True,
        help="Output .xlsx path (absolute or relative to repo root).",
    )
    args = parser.parse_args()

    out_path = Path(args.out)
    if not out_path.is_absolute():
        out_path = _REPO_ROOT / out_path
    _write(args.chart_cls, out_path)
    print(out_path)
    return 0


if __name__ == "__main__":
    raise SystemExit(main())
Manifest (expanded)
{
  "$schema": "../manifest.schema.json",
  "id": "xlsx/chart-type--doughnut-chart",
  "kind": "literal",
  "title": "Chart subclass coverage",
  "format": "xlsx",
  "category": "charts",
  "summary": "Every python-xlsx Chart subclass exposed on xlsx.chart — classic drawingml/chart subclasses (BarChart, LineChart, PieChart, Doughnut, Bubble, Scatter, Radar, Stock, Area, and the 3D variants Area3D/Line3D/Pie3D) plus the 2014+ ChartEx family (BoxWhisker, Funnel, Histogram, Map, Sunburst, Treemap, Waterfall) — must produce a workbook that carries a <chartSpace> root element in its chart part. Classic charts emit xl/charts/chart1.xml bound to the drawingml/chart namespace; ChartEx charts emit xl/charts/chartEx1.xml bound to the office/drawing/2014/chartex namespace. This family parameterises the part URI and the XPath-binding namespace URI per-case so a single assertion covers both shapes.",
  "spec": {
    "source": "ecma-376-5-part-1",
    "clause": "21.2.2",
    "element": "c:chartSpace",
    "rnc_reference": "spec/ecma-376-5/part-1/rnc/DrawingML.rnc",
    "xsd_reference": "spec/ecma-376-5/part-1/xsd/dml-chart.xsd",
    "notes": "ECMA-376 Part 1 clause 21.2.2 defines the <c:chartSpace> root and its chart subtypes (21.2.2.16 barChart, 21.2.2.97 lineChart, 21.2.2.137 pieChart, 21.2.2.159 scatterChart, 21.2.2.27 bubbleChart, 21.2.2.3 areaChart, 21.2.2.153 radarChart, 21.2.2.173 stockChart, 21.2.2.56 doughnutChart, plus the _3D variants 21.2.2.4/17/98/139). The 2014+ ChartEx subclasses (BoxWhisker, Funnel, Histogram, Map, Sunburst, Treemap, Waterfall) are Microsoft extensions specified in [MS-XLSX]/chartex, NOT in the ECMA-376 clause above — they live in a separate xl/charts/chartEx1.xml part under the http://schemas.microsoft.com/office/drawing/2014/chartex namespace (prefix cx:). This manifest covers both: the {chart.part} and {chart.ns_uri} axis fields select the right part URI and namespace URI per-case so the single //c:chartSpace xpath (where the 'c' prefix is bound per-case to either the drawingml/chart URI or the chartex URI) matches in both families. Four python-xlsx chart classes were excluded from the family because they fail to save through the minimal add_data/set_categories pipeline: BarChart3D, SurfaceChart, and SurfaceChart3D all raise TypeError: expected <class 'xlsx.chart._3d.View3D'> during save (they require an explicit View3D setup that the minimal pipeline does not supply); ChartExChart is the abstract 2014+ base class and raises AttributeError: 'ChartExChart' object has no attribute 'layoutId' because it has no concrete layout. Rendering assertions are intentionally omitted — no extant xlsxjs-style renderer draws chart content; chart presence rendering is covered by the chart-bar / chart-pie literal manifests as a fork signal."
  },
  "fixtures": {
    "machine": "xlsx/chart-type--doughnut-chart"
  },
  "generator": {
    "python": "scripts/gen_chart_type.py",
    "arg_template": "--chart-cls {chart.cls} --out fixtures/xlsx/chart-type--{chart.id}.xlsx"
  },
  "_expansion": {
    "parent_id": "xlsx/chart-type",
    "bindings": {
      "chart": "doughnut-chart"
    }
  },
  "assertions": [
    {
      "id": "chart-part-exists-doughnut-chart",
      "part": "xl/charts/chart1.xml",
      "namespaces": {
        "c": "http://schemas.openxmlformats.org/drawingml/2006/chart"
      },
      "xpath": "//c:chartSpace",
      "must": "exist",
      "description": "The chart part must carry a <chartSpace> root element. For classic chart subclasses (ECMA-376 21.2.2) this is <c:chartSpace> in xl/charts/chart1.xml under the drawingml/chart namespace; for 2014+ ChartEx subclasses it is <cx:chartSpace> in xl/charts/chartEx1.xml under the office/drawing/2014/chartex namespace. The 'c' prefix in the xpath is a local binding only — it is bound per-case to whichever of those two URIs applies."
    }
  ]
}
Fixture
Download chart-type--doughnut-chart.xlsx (6.2 KB)Reference preview
Reference (machine, page 1 PNG)
Reference PDF
Download PDF Open in PDF.js
Spec notes
ECMA-376 Part 1 clause 21.2.2 defines the <c:chartSpace> root and its chart subtypes (21.2.2.16 barChart, 21.2.2.97 lineChart, 21.2.2.137 pieChart, 21.2.2.159 scatterChart, 21.2.2.27 bubbleChart, 21.2.2.3 areaChart, 21.2.2.153 radarChart, 21.2.2.173 stockChart, 21.2.2.56 doughnutChart, plus the _3D variants 21.2.2.4/17/98/139). The 2014+ ChartEx subclasses (BoxWhisker, Funnel, Histogram, Map, Sunburst, Treemap, Waterfall) are Microsoft extensions specified in [MS-XLSX]/chartex, NOT in the ECMA-376 clause above — they live in a separate xl/charts/chartEx1.xml part under the http://schemas.microsoft.com/office/drawing/2014/chartex namespace (prefix cx:). This manifest covers both: the {chart.part} and {chart.ns_uri} axis fields select the right part URI and namespace URI per-case so the single //c:chartSpace xpath (where the 'c' prefix is bound per-case to either the drawingml/chart URI or the chartex URI) matches in both families. Four python-xlsx chart classes were excluded from the family because they fail to save through the minimal add_data/set_categories pipeline: BarChart3D, SurfaceChart, and SurfaceChart3D all raise TypeError: expected <class 'xlsx.chart._3d.View3D'> during save (they require an explicit View3D setup that the minimal pipeline does not supply); ChartExChart is the abstract 2014+ base class and raises AttributeError: 'ChartExChart' object has no attribute 'layoutId' because it has no concrete layout. Rendering assertions are intentionally omitted — no extant xlsxjs-style renderer draws chart content; chart presence rendering is covered by the chart-bar / chart-pie literal manifests as a fork signal.