Metadata
| Feature id | pptx/chart-column |
|---|---|
| Format | pptx |
| Category | charts |
| Spec | ecma-376-5-part-1 § 21.2.2 c:chartSpace |
XPath assertions
| ID / part | Predicate | XPath | python-pptx | pptxjs |
|---|---|---|---|---|
chart-bar-direction-colppt/charts/chart1.xml | equal = colThe chart part must carry <c:barChart>/<c:barDir val="col"/> — the distinguishing attribute of a clustered column chart (as opposed to val="bar"). | //c:chartSpace//c:barChart/c:barDir/@val | — | — |
chart-part-exists-on-slideppt/slides/slide1.xml | match = ^rId\d+$The slide must carry a <p:graphicFrame> whose <a:graphicData> URI identifies it as a chart and whose inner <c:chart> references the chart part via r:id='rIdN'. | //p:graphicFrame/a:graphic/a:graphicData[@uri='http://schemas.openxmlformats.org/drawingml/2006/chart']/c:chart/@r:id | — | — |
Render assertions
| ID | Predicate | Selector | python-pptx | pptxjs |
|---|---|---|---|---|
chart-column-rendered | css_selector/ existA DOM node marked as a chart must be rendered. Most current pptxjs-style renderers do not implement chart rendering — this assertion is expected to fail for those libraries and is the canonical fork signal. | .chart, [data-chart-type='column'], [data-chart-type='columnClustered'], [data-kind='chart'], svg.chart, .pptx-chart | — | fail |
slide-count | css_selector/ equal-countExactly one slide container must be rendered. Catches renderers that emit zero slides (hard failure) or duplicate the slide. | section.pptx-slide, .pptx-slide, section[data-slide], .slide, [data-slide] | — | — |
Generator source
scripts/gen_chart_column.py
#!/usr/bin/env python3
"""Generate ``fixtures/pptx/chart-column.pptx``.

A one-slide presentation carrying a clustered column chart
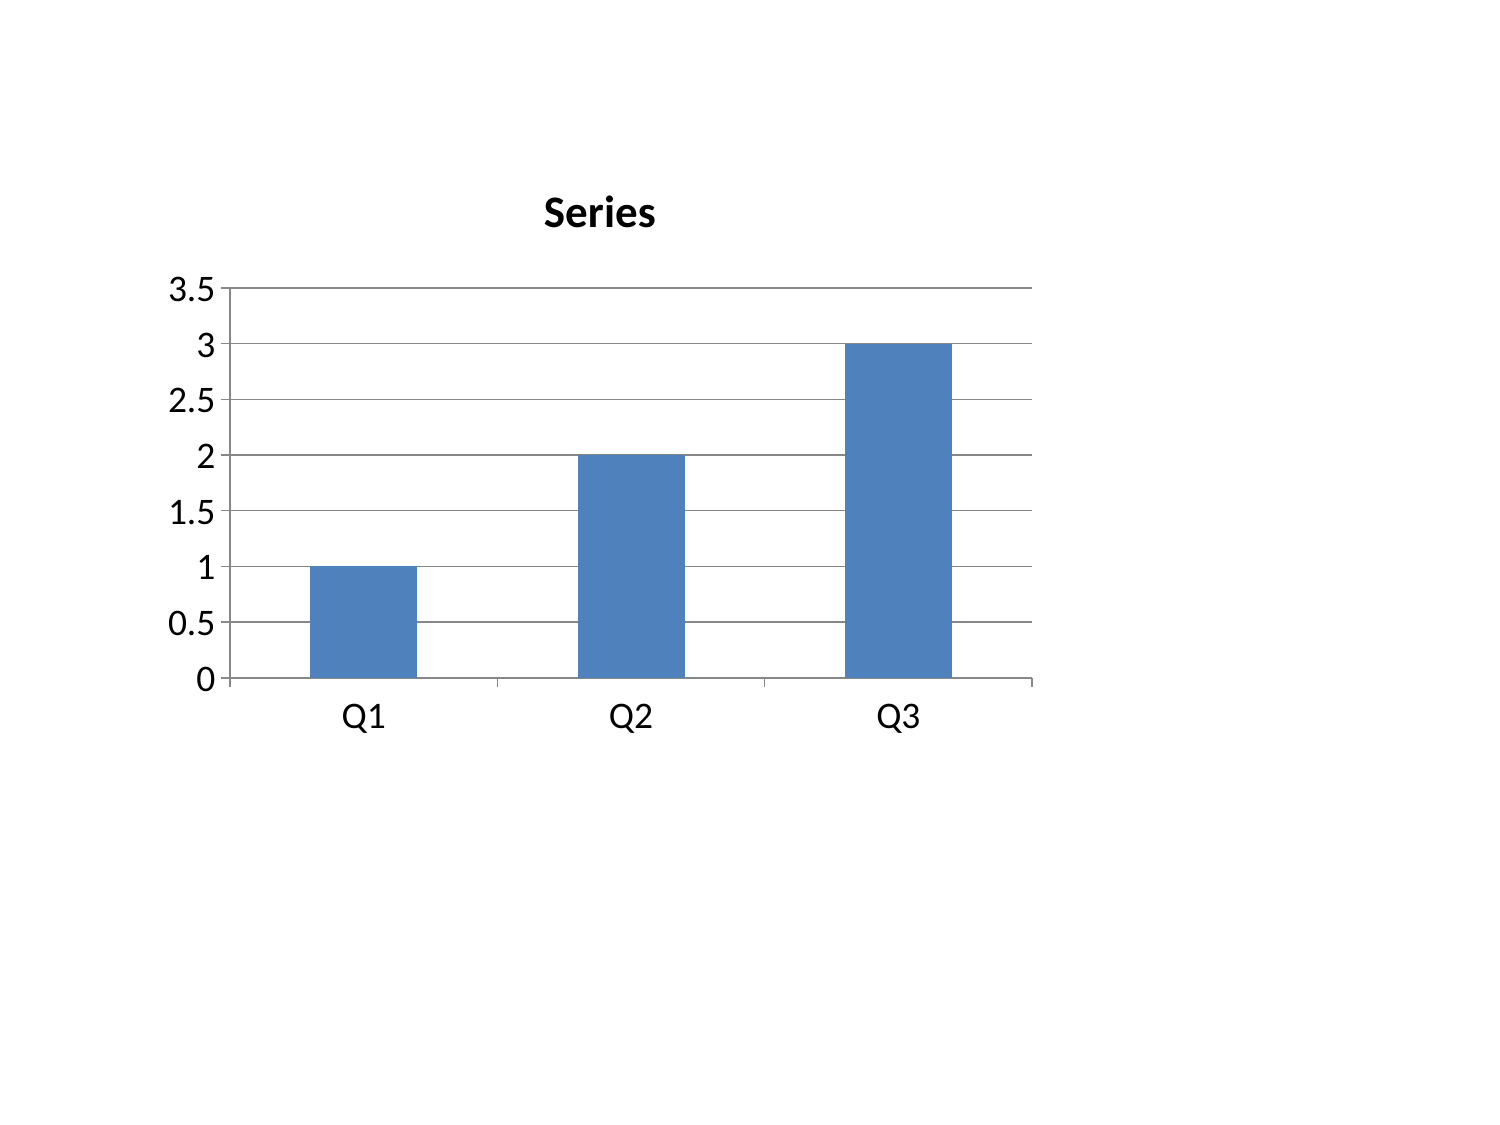
(``XL_CHART_TYPE.COLUMN_CLUSTERED``) with three categories and one
series. python-pptx writes the chart body to ``ppt/charts/chart1.xml``
and references it from the slide via <p:graphicFrame>. Designed to
satisfy the assertions in ``features/pptx/chart-column.json``.
"""

from __future__ import annotations

from pathlib import Path

from pptx import Presentation
from pptx.chart.data import CategoryChartData
from pptx.enum.chart import XL_CHART_TYPE
from pptx.util import Inches

import datetime as _dt
_REPRODUCIBLE_DT = _dt.datetime(2000, 1, 1, 0, 0, 0)

_REPO_ROOT = Path(__file__).resolve().parent.parent
_OUT = _REPO_ROOT / "fixtures" / "pptx" / "chart-column.pptx"


def main() -> int:
    prs = Presentation()
    # slide_layouts[5] is the "title only" layout; the chart is the only
    # non-placeholder content we add.
    slide = prs.slides.add_slide(prs.slide_layouts[5])

    chart_data = CategoryChartData()
    chart_data.categories = ["Q1", "Q2", "Q3"]
    chart_data.add_series("Series", (1.0, 2.0, 3.0))

    slide.shapes.add_chart(
        XL_CHART_TYPE.COLUMN_CLUSTERED,
        Inches(1),
        Inches(1),
        Inches(6),
        Inches(4),
        chart_data,
    )

    _OUT.parent.mkdir(parents=True, exist_ok=True)
    prs.save(_OUT, zip_date_time=_REPRODUCIBLE_DT)
    print(_OUT)
    return 0


if __name__ == "__main__":
    raise SystemExit(main())
Manifest (expanded)
{
  "$schema": "../manifest.schema.json",
  "id": "pptx/chart-column",
  "title": "Clustered column chart",
  "format": "pptx",
  "category": "charts",
  "summary": "A clustered column chart (XL_CHART_TYPE.COLUMN_CLUSTERED) added via shapes.add_chart produces a ppt/charts/chart1.xml part whose <c:plotArea> carries a <c:barChart> with <c:barDir val=\"col\"/>.",
  "spec": {
    "source": "ecma-376-5-part-1",
    "clause": "21.2.2",
    "element": "c:chartSpace",
    "rnc_reference": "spec/ecma-376-5/part-1/rnc/DrawingML.rnc",
    "xsd_reference": "spec/ecma-376-5/part-1/xsd/dml-chart.xsd",
    "notes": "python-pptx emits shapes.add_chart(COLUMN_CLUSTERED, ...) as a <p:graphicFrame> on the slide referencing a chart part under ppt/charts/chartN.xml. Both a clustered column and a clustered bar chart are represented by <c:barChart>; the distinguishing attribute is <c:barDir val=\"col\"/> vs val=\"bar\". The slide-side element is <p:graphicFrame><a:graphic><a:graphicData uri='...chart'/><c:chart r:id='rIdN'/>, not <p:sp>."
  },
  "fixtures": {
    "machine": "pptx/chart-column",
    "office": "pptx/chart-column"
  },
  "generator": {
    "python": "scripts/gen_chart_column.py"
  },
  "assertions": [
    {
      "id": "chart-bar-direction-col",
      "part": "ppt/charts/chart1.xml",
      "namespaces": {
        "c": "http://schemas.openxmlformats.org/drawingml/2006/chart"
      },
      "xpath": "//c:chartSpace//c:barChart/c:barDir/@val",
      "must": "equal",
      "value": "col",
      "description": "The chart part must carry <c:barChart>/<c:barDir val=\"col\"/> — the distinguishing attribute of a clustered column chart (as opposed to val=\"bar\")."
    },
    {
      "id": "chart-part-exists-on-slide",
      "part": "ppt/slides/slide1.xml",
      "namespaces": {
        "p": "http://schemas.openxmlformats.org/presentationml/2006/main",
        "a": "http://schemas.openxmlformats.org/drawingml/2006/main",
        "c": "http://schemas.openxmlformats.org/drawingml/2006/chart",
        "r": "http://schemas.openxmlformats.org/officeDocument/2006/relationships"
      },
      "xpath": "//p:graphicFrame/a:graphic/a:graphicData[@uri='http://schemas.openxmlformats.org/drawingml/2006/chart']/c:chart/@r:id",
      "must": "match",
      "value": "^rId\\d+$",
      "description": "The slide must carry a <p:graphicFrame> whose <a:graphicData> URI identifies it as a chart and whose inner <c:chart> references the chart part via r:id='rIdN'."
    }
  ],
  "render_assertions": [
    {
      "id": "chart-column-rendered",
      "kind": "css_selector",
      "selector": ".chart, [data-chart-type='column'], [data-chart-type='columnClustered'], [data-kind='chart'], svg.chart, .pptx-chart",
      "must": "exist",
      "description": "A DOM node marked as a chart must be rendered. Most current pptxjs-style renderers do not implement chart rendering — this assertion is expected to fail for those libraries and is the canonical fork signal."
    },
    {
      "id": "slide-count",
      "kind": "css_selector",
      "selector": "section.pptx-slide, .pptx-slide, section[data-slide], .slide, [data-slide]",
      "must": "equal-count",
      "count": 1,
      "description": "Exactly one slide container must be rendered. Catches renderers that emit zero slides (hard failure) or duplicate the slide."
    }
  ]
}
Fixture
Download chart-column.pptx (33.5 KB)Reference preview
Reference (machine, page 1 PNG)
Reference PDF
Download PDF Open in PDF.js
Spec notes
python-pptx emits shapes.add_chart(COLUMN_CLUSTERED, ...) as a <p:graphicFrame> on the slide referencing a chart part under ppt/charts/chartN.xml. Both a clustered column and a clustered bar chart are represented by <c:barChart>; the distinguishing attribute is <c:barDir val="col"/> vs val="bar". The slide-side element is <p:graphicFrame><a:graphic><a:graphicData uri='...chart'/><c:chart r:id='rIdN'/>, not <p:sp>.